One of the most important things that needs to be monitored in a real-time data network is Latency. There are plenty of tools for monitoring performance at the bits and bytes level, but they’re not going to tell you if your update to a three-month future is taking as long as that to get from New York to Tokyo.
A few years back it struck us (or rather, it struck one of our customers – we get all our best ideas from them) that PlatformOne™ would be the perfect tool for providing an independent measure of latency at the level of real-time data itself. So that’s how we ended up building the Tracker product.
The central concept in Tracker is that of a journey. A journey is the path that a single item of data takes through a network. Each step along a journey is called a datapoint. As an example, consider a contribution to a vendor via Marketlink. Let’s complicate things slightly by saying that this item of data is published into market data system in Tokyo. However, the actual contribution is handled by a contribution process situated in London. So we have three datapoints:
- MDS in Tokyo
- MDS in London
- Contribution server in London.
This is what this journey looks like:
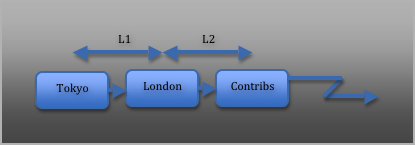
In this journey, our network has introduced two latencies, L1 and L2. By measuring these, we can determine how well our network is performing, and take steps to improve things if the delays are significant.
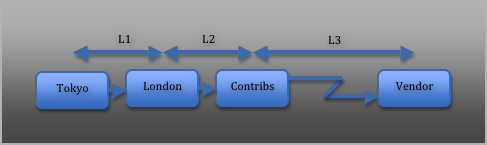
However, all we’ve measured here is internal latency. We haven’t yet taken into account how our vendor is performing. And more often than not, that’s the biggest delay of all. So we need to add a fourth datapoint to our example – what our item looks like on the vendor’s datafeed:
So how does Tracker measure this latency? First of all, we need an agent at each datapoint, to watch the data in real time as it passes through. Secondly, we need a central monitoring process to receive the updates from each agent and collate them into a coherent sequence. This is what our monitoring network looks like:
![]()
The thing is, because Tracker is based on PlatformOne™, we already have a considerable range of agents to choose from. We have interfaces to all the major market data systems, as well as a wide range of feeds and other systems. We also have some slightly more obscure agents available, such as the one that monitors published SASS3 packets before they get re-distributed. And it goes without saying that any existing custom system can be turned into an agent very easily by using one of the extensive range of PlatformOne™ APIs. In addition to this, JPA’s own range of contribution products all have agent capability built into them.
Tracker builds up its picture of latency in one of two ways. If there’s a sequence number built into the data, it can use that to identify the updates from all the different agents. If there isn’t, it simply matches up a series of updates to a given field. Having established the raw latency at each step in the journey as the time difference between the arrival of the updates from each agent, it offsets that by the underlying latency between the various systems to establish a true latency.
This latency data is logged to files for later analysis and – more importantly – is delivered by Tracker as its own real-time feed. This feed can then be used in any number of ways. It could be piped into Excel via the LiteStation™ add-in, perhaps, or into the Condition Monitor and hence into SNMP. Or perhaps into the customer’s own alert system, via a purpose-built interface.